Step by step
-
Open the sent mailing in the
 Analysis workflow step.
The visual link analysis for the mailing will be generated.
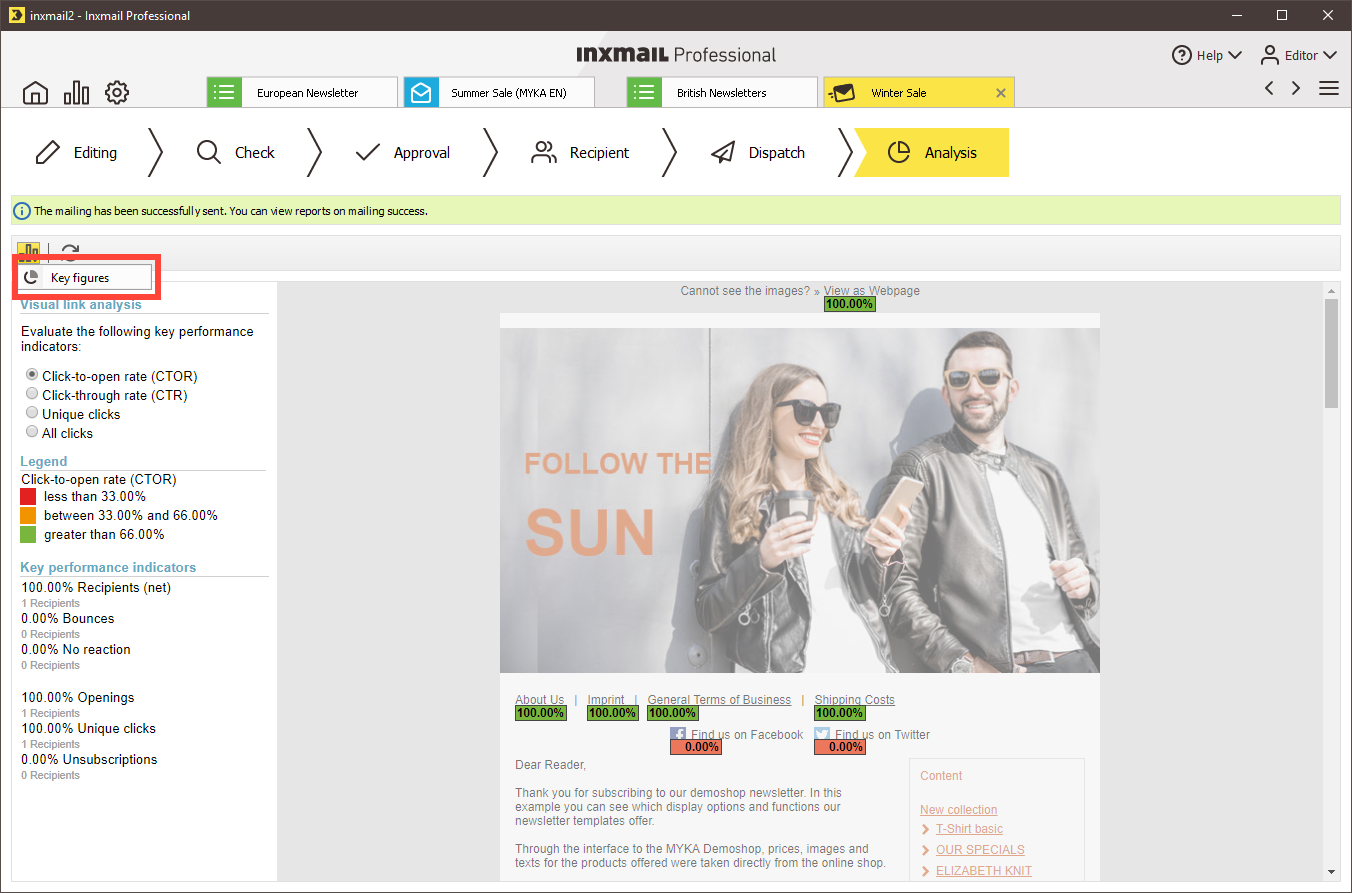
This report graphically displays the links that recipients clicked (how often). The analysis is generated for the recipient currently selected in the
 Check workflow step using the Contents button. In the area on the left, you can configure the key performance indicators for which the visual link evaluation should be generated.
Key figure for report
Description
Click-to-open rate (CTOR) (%)
Unique clicks/number of times opened
Click-through rate (CTR) (%) related to graphic call-ups
Unique graphic call-ups/Number of net recipients
Unique clicks
Number of recipients who clicked the tracked link at least once
All clicks
Total number of clicks of the tracked link, including multiple clicks
Recipients (net)
Number of recipients who actually received the mailing (without delivery errors such as hard bounces)
Bounces
Number of hard and soft bounces for a mailing dispatch
Openings (%)
Number of opening recipients/number of net recipients
Unsubscriptions (%)
Number of unsubscribe clicks/Number of net recipients
The legend will be generated in real time to match the performance indicators you select. During this process, Inxmail Professional determines the classification into links marked green, orange and red based on the click values of the current mailing (for example, how often a single link in this mailing was most frequently clicked; how often the links in this mailing were clicked on average). This allows you to recognise which links in your mailing were clicked frequently and which links infrequently.
Explanation for determining colour identification The threshold value for grouping into the corresponding colour category is a third of the CTOR of the most frequently clicked link. Red therefore means that the corresponding links were clicked less than a third as often as the most frequently clicked link. Yellow means between one and two thirds, and green means more than two thirds.
- You can use the following buttons:
- The
 (Display selected reports) button allows you to open other reports on the mailing.
 -
The
 (Refresh) button refreshes your report data in real time.
Note: The results of the visual link analysis cannot be exported.
- You have successfully viewed the mailing analysis.
Related topics
Inxmail Professional:
2 possible use cases
Depending on your contract, you might use Inxmail Professional in different ways:
-
As part of the Inxmail platform: You use newsletters & campaigns as your main tool for creating and sending newsletters. Inxmail Professional only serves as a recipient database and configuration tool in the background.
We are constantly expanding the functionality of “Newsletters & Campaigns”. Check out newsletters & campaigns section to find out if the feature you are looking for might already be available there.
-
Full scope: You use the legacy tool Inxmail Professional as your main tool for creating and sending newsletters.
Did you not find what you were looking for?
-
Send us your feedback.
