In the ![]() "A/B reports" navigation item, you can see the most important statistics on your A/B workflows at a glance.
"A/B reports" navigation item, you can see the most important statistics on your A/B workflows at a glance.
Step by step
-
Open the
 "A/B reports" navigation item in the
  "Reporting" section.
 -
Select an A/B workflow whose performance you would like to view.
-
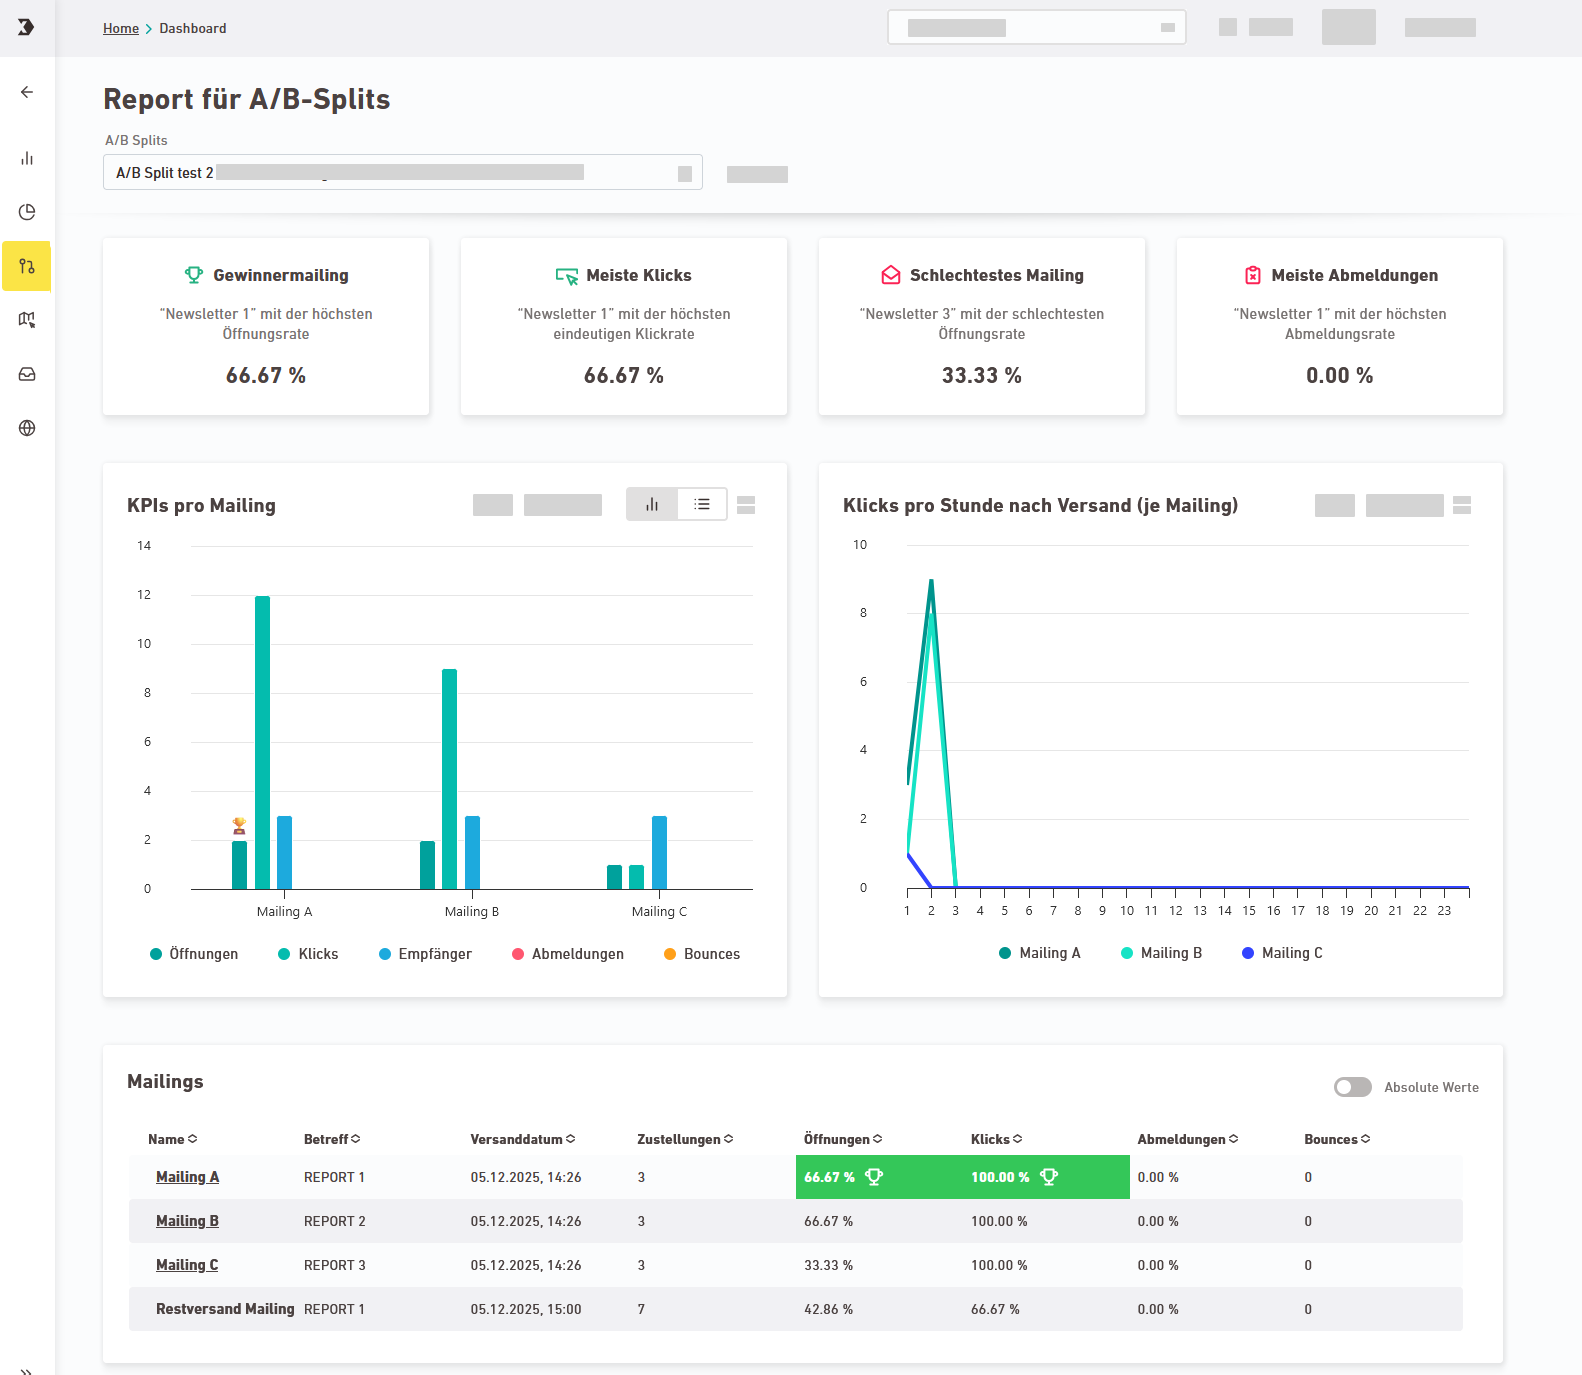
The tiles give you a quick overview of the winners and losers of your A/B test:
- Winning mailing (highest opening rate)
- Most clicks
- Worst mailing (lowest opening rate)
- Most unsubscribes
-
You can see additional KPIs in the charts and in the table view.
-
Openings
-
Clicks
-
Recipients
-
Unsubscribes
-
Bounces
-
Deliveries
-
Clicks per hour after dispatch (per mailing)
-
-
You have viewed the performance data for an A/B workflow.
Did you not find what you were looking for?
-
Send us your feedback.
