Once the workflow has been activated, the workflow key figures are displayed in the individual elements.
Cycle figures
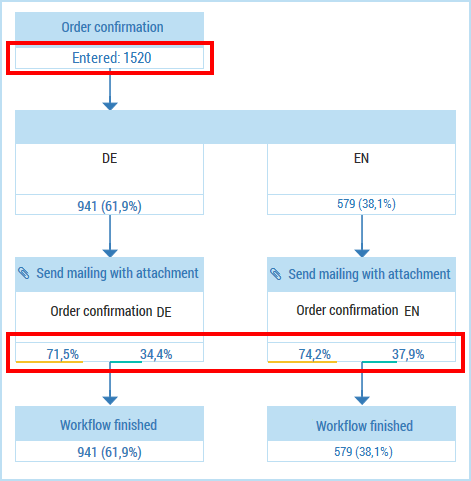
The start element of the workflow shows the number of recipients for whom the event was triggered.
The end element of the workflow shows the number of recipients who have gone through the event workflow.
The Perform A/B test and Apply filter element types show the allocation of the recipients from the element positioned above (parent element). The absolute figures and the percentage allocation are displayed.
Open and click rates
The Mailing and Mailing with attachment element types show the open rate (on the left, above a yellow bar) and the click rate (on the right, above a green bar) of the sent emails.
The Wait element type shows the number of emails for which the wait interval for sending has not yet passed (emails are still continuing through this element of the workflow).

Updating of the key figures
The cycle times are continuously updated. The open and click rates are updated every 15 minutes.
The key figures always apply for the period from the last workflow activation. If you edit the workflow and then reactivate it, the key figures are reset to zero.
Blocked recipients
Blocked recipients are included in the number of emails to be sent and the number of emails that have been sent.

